Facebook announced another glitch with its metrics and marketers start wondering whether they can really trust the social network’s measuring methods.
It’s the third time in the last three months that Facebook reports a problem with its metrics and this has affected its credibility among marketers and publishers.
As the most popular social platform the expectations are high and Facebook’s ambitious plans that keep growing year by year bring out bigger challenges. As marketers and publishers invest more time (and money) on it, they are expecting a Return On Investment for their efforts. Thus, they weren’t happy when they found out a problem in accuracy that occurred several times.
Case #1 – September 2016
The first case was revealed in September when Facebook admitted that there was a miscalculation in the average viewing time for video ads the past two years. This led to an artificial inflation in the video views
This led to an artificial inflation of the viewing time in video ads, as it took into consideration all the video views of more than three seconds. According to Publicis Media, this has overestimated the average viewing time by 60% to 80%, while Facebook made it clear that this error didn’t affect billing.
Case #2 – November 2016

November was a busy month for Facebook and everyone working on its metrics, as there were miscalculations with the video views, the monthly Page reach, and the time spent on Instant Articles.
In more detail:
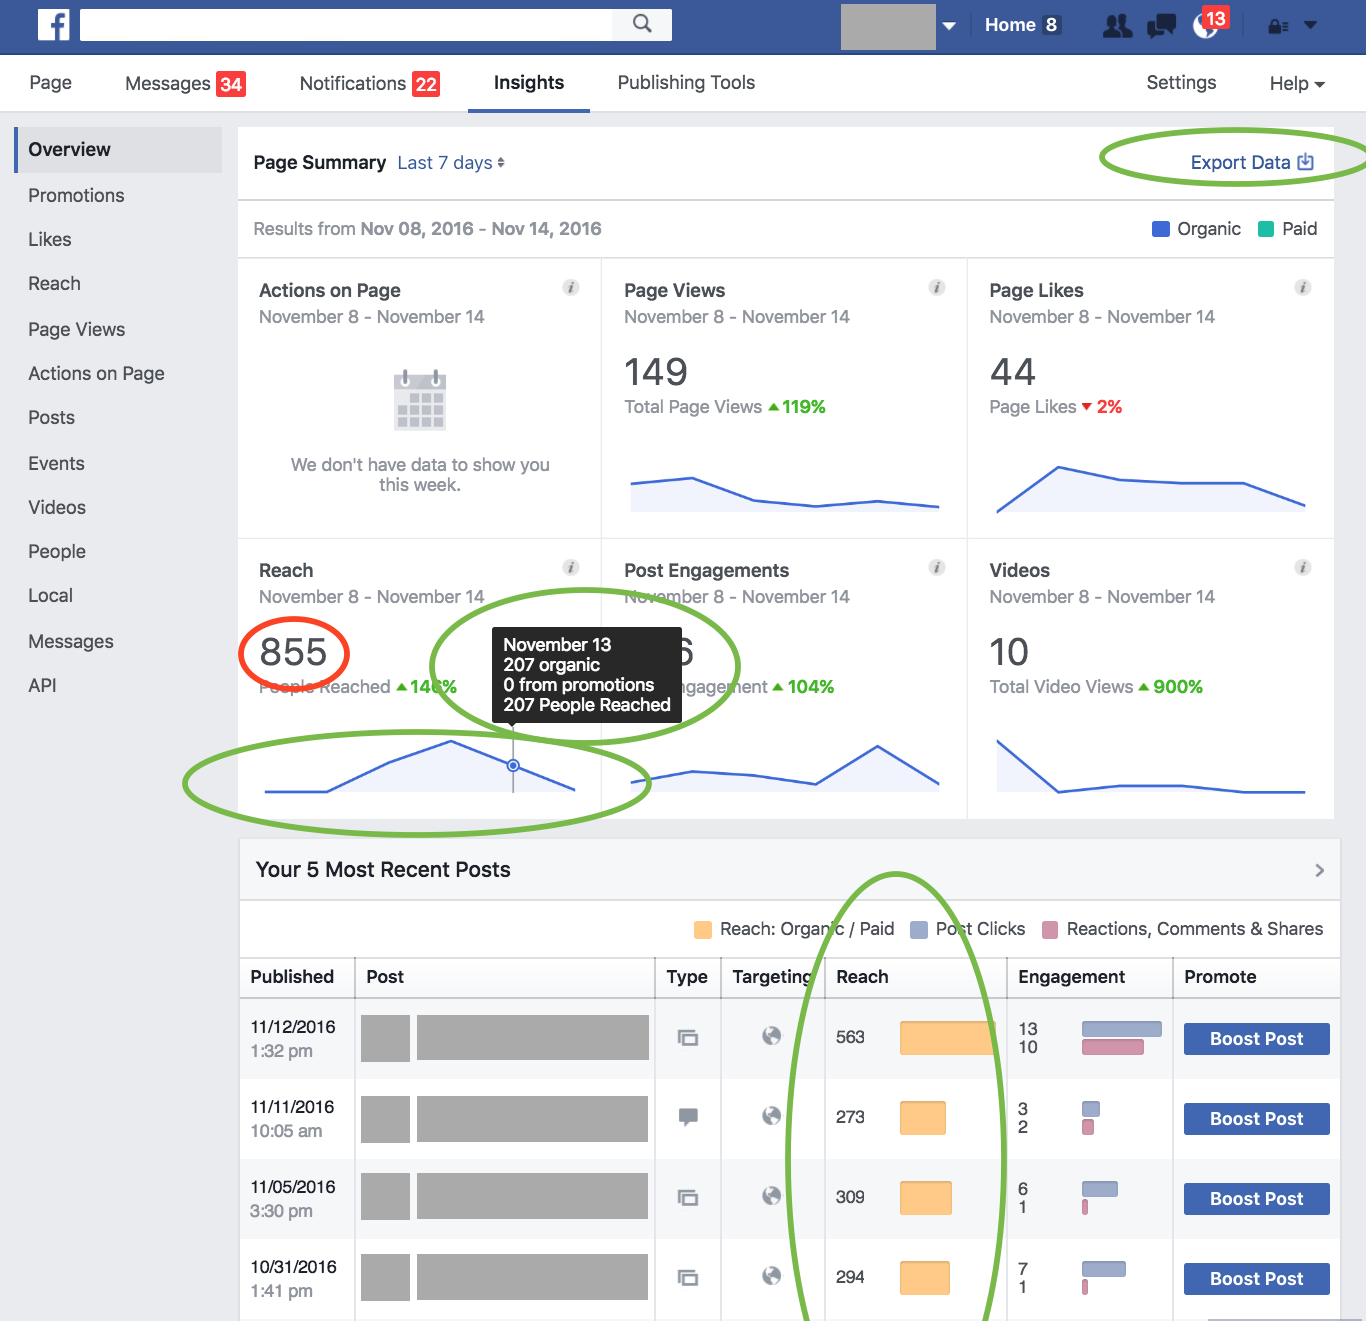
Facebook uncovered a bug in Page Insights with the weekly and monthly summaries miscalculating the total numbers without taking into consideration the repeat visitors. This brought a reduced reach of 33% for the 7-day summary and 55% for the 28-day summary. According to Facebook, this didn’t affect the paid reach.
There was a small miscalculation to the length of the videos, with a difference of one to two seconds in the final result, due to occasional problems of syncing the audio and the video to each device.
There was an over-reporting of 7-8% on the time spent on Instant Articles since last August. Facebook reported that this issue is now fixed.
The “Referrals” metrics on Facebook Analytics for Apps was also miscalculated, as it didn’t simply track the links to the app or the site, but also the clicks to the posts via the app or the site, which also included the clicks to view photos and videos.

Case #3 – December 2016

Facebook announced more updates for its metrics, along with new miscalculations and fixes, this time affecting the estimated reach, the measurement of the reactions in live videos and a problem with like and share buttons.
There will be an improvement in the estimated reach during the ad creation, which will provide a more accurate estimate for the potential target audience. We should expect from now on a change of less than 10% (increase or decrease).
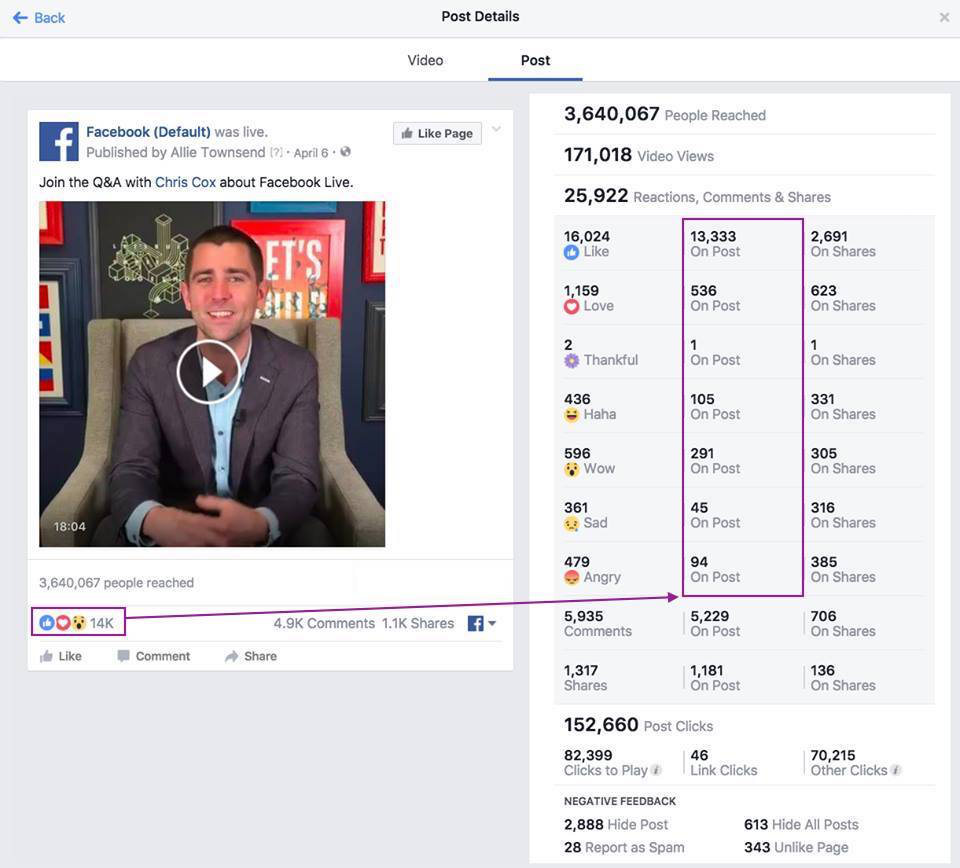
Facebook is fixing the reactions in live videos by counting from now on multiple reactions during a live streaming. These multiple reactions were calculated up to now on the “reactions from shares to post” and they will be now measured on the “reactions on post” metrics. This means that we should see an increase of 500% on average to the “reactions on post” and a decrease of 25% on average to the “reactions from shares of post”.
Facebook also identified a discrepancy between the like and share buttons on the Graph API and the URLs used in the mobile search bar, fixing this difference to make the metrics match up.
Is Facebook ready to improve its metrics?
It is more important than ever for Facebook to include third-party verification for its metrics and it already made it clear last month that they are heading towards this direction:
We believe strongly in third-party verification to prove the business value we’re driving for our partners, and we have a long history of working with global industry leaders like comScore, Moat, Nielsen and Integral Ad Science (IAS). We’re now exploring additional third-party reviews to validate the reporting we offer partners. We’re also launching the ability to verify display impression data through our third-party viewability verification partners, including Moat, IAS and comScore. This integration addresses requests we’ve received from partners for independent measurement of the amount of time ads are viewed on-screen.
For publishers, we’re partnering with Nielsen to include Facebook video and Facebook Live viewership in Nielsen’s Digital Content Ratings (DCR). This will give publishers access to third-party verification for video metrics and allow for comparable digital and TV metrics in Nielsen’s Total Audience Measurement.
Should marketers be concerned?
Marketers and publishers have every right to be unhappy with Facebook’s continuous glitches and it certainly affected its credibility up to a point.
However, looking on the bright side, it may be a good opportunity for the social network to evaluate the growing needs and examine third parties that could help them scale their efforts.
As the products evolve, it’s important to focus on maintaining its quality and we are hoping that these problems will help Facebook work harder on the right direction.
If it wants to be taken seriously for its advertising platform and its business aspect, then it’s crucial to bring back the much desired trust and invest in the proper tools that will make the measurement more accurate. This should be an interesting challenge for 2017.

