
What Link Building Success Really Looks Like
Posted by mark-johnstone
A few weeks ago, a post was published entitled The SEO Myth of Going Viral. It referenced 8 pieces of content across 4 different sites that went viral and, most importantly for SEO, gained hundreds of linking root domains. I was the creative director on a lot of those campaigns while working as the VP of Creative at Distilled. Today, I’d like to add some important context and detail to the original post.
I actually agree with much of what it said. However, it’s based on the assumption that one big viral piece of content would result in a visible jump in rankings across the domain within about 3 months of the content being released. There are a few challenges with this as a basis for measuring success.
I wouldn’t advise setting your hopes on one big viral hit boosting your rankings across the domain. Not by itself. However, if that viral hit is part of ongoing link building efforts in which you build lots of links to lots of pieces of content, you can begin to see an upwards trend.
“Trend” is the important word here. If you’re looking for a dramatic step or jump as a direct result of one piece of viral content, this could cause you to overlook a positive trend in the right direction, and even tempt you to conclude that this form of content-based link building doesn’t work.
With regards to this type of link building and its impact on domain-wide rankings, I’d like to focus on the follow 4 points:
How success really looksWhy success looks like it doesOther factors you need to considerHow we can improve our approachWhat successful link building really looks like
Simply Business was held up in the SEO myth post as an example of this kind of link building not working. I would argue the opposite, holding it up as an example of it working. So how can this be?
I believe it stems from a misunderstanding of what success looks like.
The post highlighted three of the most successful pieces of content Distilled created for Simply Business. However, focusing on those three pieces of content doesn’t provide the full picture. We didn’t make just three pieces of content; we made twenty-one. Here are the results of those pieces:

Note: Data missing for the first two pieces of content
That’s links from 1466 domains built to 19 pieces of content over a period of 3 years.
The myth in question is as follows:
Building lots of links to one piece of content will result in a jump in domain-wide rankings within a reasonable timeframe, e.g. 3 months.
Though this wasn’t the hypothesis explicitly stated at the start of the post, it was later clarified in a comment. However, that’s not necessarily how this works.
An accurate description of what works would be:
Building lots of links to lots of pieces of content sustainably, while taking other important factors into consideration, can result in an increase in domain-wide rankings over time.
To hold up, the myth required a directly attributable jump in rankings and organic traffic within approximately 3 months of the release of each piece of content. So where was the bump? The anticipated reward for all those links?

No. The movement we’re looking for is here:

Not a jump, but a general trend. Up and to the right.
Below is a SEMRush graph from the original post, showing estimated organic traffic to the Simply Business site:

At first glance, the graph between 2012 and 2014 might look unremarkable, but that’s because the four large spikes on the right-hand side push the rest of the chart down, creating a flattening effect. There’s actually a 170% rise in traffic from June 2012 to June 2014. To see that more clearly, here’s the same data (up to June 2014) on a different scale:

Paints quite a different picture, don’t you think?
Okay, but what did this do for the company? Did they see an increase in rankings for valuable terms, or just terms related to the content itself?
Over the duration of these link building campaigns, Simply Business saw their most important keywords (“professional indemnity insurance” and “public liability insurance”) move from positions 3 to 1 and 3 to 2, respectively. While writing this post, I contacted Jasper Martens, former Head of Marketing and Communications at Simply Business, now VP of Marketing at PensionBee. Jasper told me:
“A position change from 3 to 1 on our top keyword meant a 15% increase in sales.”
That translates to money. A serious amount of it!
Simply Business also saw ranking improvements for other commercial terms, too. Here’s a small sample:

Note: This data was taken from a third-party tool, Sistrix. Data from third-party tools, as used both in this post and the original post, should be taken with a grain of salt. They don’t provide a totally accurate picture, but they can give you some indication of the direction of movement.
I notice Simply Business still ranks #1 today for some of their top commercial keywords, such as “professional indemnity insurance.” That’s pretty incredible in a market filled with some seriously big players, household UK names with familiar TV ads and much bigger budgets.
Why success looks like it does
I remember the first time I was responsible for a piece of content going viral. The social shares, traffic, and links were rolling in. This was it! Link building nirvana! I was sitting back waiting for the rankings, organic traffic, and revenue to follow.
That day didn’t come.
I was gutted. I felt robbed!
I’ve come to terms with it now. But at the time, it was a blow.
I assume most SEOs know it doesn’t work that way. But maybe they don’t. Maybe there’s an assumption that one big burst in links will result in a jump in rankings, as discussed in the original post. That’s the myth it was seeking to dispel. I get it. I’ve been there, too.
It doesn’t necessarily work that way. And, actually, it makes sense that it doesn’t.
In two of the examples, the sites in question had one big viral hit, gaining hundreds of linking root domains, but this on its own didn’t result in a boost in domain-wide rankings. That’s true.Google would have pretty volatile search results if every time someone had a viral hit, they jumped up in the rankings for all their head terms. But if a site continues to build lots of links regularly over time, like Simply Business did, Google might want that site to be weighted more favorably and worthy of ranking higher.
The Google algorithm is an incredibly complex equation. It’s tempting to think that you put links in and you get rankings out, and a big jump in one will correspond to a big jump in the other. But the math involved is far more complicated than that. It’s not that linear.
Other factors to consider
Link building alone won’t improve your rankings.
There are a number of other influential factors at play. At a high level, these include:
A variety of on-site (and technical) SEO factorsAlgorithmic updates and penaltiesChanges to the SERPs, like the knowledge box and position of paid resultsCompetitor activity
I’m not going to go into great detail here, but I wanted to mention that you need to consider these factors and more when reviewing the impact of link building on a site’s rankings.
Below is the graph from SearchMetrics for Concert Hotels, also via the original post. This is another site to which Distilled built a high volume of links.

As you can possibly tell from the large drop before Distilled started working with Concert Hotels, the site was suffering from an algorithmic penalty. We proceeded under the hypothesis that building high-quality links, alongside other on-site activity, would be important in the site’s recovery.
However, after three or four large link building successes without any corresponding uplift, we recommended to the client that we stop building links and shift all resources to focus on other activities.
As you’ll see at the end of the chart, there appears to be some positive movement happening. If and when the site fully recovers, we’ll never be able to tell exactly what contribution, if any, link building made to the site’s eventual rankings.
You can’t take the above as proof that link building doesn’t work. You have to consider the other factors that might be affecting a site’s performance.
How can we improve our approach?
As I mentioned at the start of this post, I actually agree with a lot of the points raised in the original post. In particular, there were some strong points made about the topical relevance of the content you create and the way in which the content sits within the site architecture.
Ideally, the content you create to gain links would be:
Topically relevant to what you doIntegrated into the site architecture to distribute link equityValuable in its own right (even if it weren’t for links and SEO)
This can be a challenge, though, especially in certain industries, and you might not hit the sweet spot every time.
But let’s look at them in turn.
Topical relevance
If you can create a piece of content that gains links and is closely relevant to your product and what you do for customers, that’s great. That’s the ideal.
To give you an example of this, Distilled created a career aptitude test for Rasmussen, a career-focused college in America. This page earned links from 156 linking root domains (according to the Majestic Historic Index), and the site continues to rank well and drive relevant search traffic to the site.
Another example would be Moz’s own Search Engine Ranking Factors. Building lots of links to that page will certainly drive relevant and valuable traffic to the Moz site, as well as contributing to the overall strength of the domain.
However, your content doesn’t have to be about your product, as long as it’s relevant to your audience. In the case of Simply Business, the core audience (small business owners) doesn’t care about insurance as much as it cares about growing its businesses. That’s why we created several guides to small business marketing, which also gained lots of links.
As Jasper Martens explains:
“Before I left Simply Business, the guides we created attracted 15,000 unique visits a month with a healthy CTR to sign-up and sales. It was very effective to move prospects down the funnel and make them sales-ready. It also attracted a lot of small business owners not looking for insurance right now.”Integrating the content into the site architecture
Distilled often places content outside the main architecture of the site. I’ll accept this isn’t optimal, but just for context, let me explain the reasons behind it:
It creates a more immersive and compelling experience. Consider how impactful New York Times’ Snowfall would have been if it had to sit inside the normal page layout.It prevents conflicts between the site’s code and the interactive content’s code. This can be particularly useful for organizations that have restrictive development cycles, making live edits on the site difficult to negotiate. It also helps reduce the time, cost, and frustration on both the client-side and agency-side.It looks less branded. If a page looks too commercial, it can deter publishers from linking.
While it worked for Simply Business, it would make sense, where you can, to pull these things into the normal site architecture to help distribute link equity further.
Content that’s valuable in its own right (even if it weren’t for links and SEO)
Google is always changing. What’s working now and what’s worked in the past won’t necessarily continue to be the case. The most future-proof way you can build links to your site is via activity that’s valuable in its own right — activities like PR, branding, and growing your audience online.
So where do we go from here?
Link building via content marketing campaigns can still make a positive impact to domain-wide rankings. However, it’s important to enter any link building campaign with realistic expectations. The results might not be as direct and immediate as you might hope.
You need to be in it for the long haul, and build links to a number of pieces of content over time before you’ll really see results. When looking for results, focus on overall trends, not month-to-month movements.
Remember that link building alone won’t solve your SEO. You need to make sure you take other on-site, technical, and algorithmic factors into consideration.
It’s always worth refining the way you’re building links. The closer the topics are aligned with your product or core audience’s interests, the more the content is integrated into your site’s architecture, and the more the content you’re creating is valuable for reasons beyond SEO, the better.
It’s not easy to manage that every time, but if you can, you’ll be in a good position to sustainably build links and improve your site’s rankings over time.
Sign up for The Moz Top 10, a semimonthly mailer updating you on the top ten hottest pieces of SEO news, tips, and rad links uncovered by the Moz team. Think of it as your exclusive digest of stuff you don’t have time to hunt down but want to read!
![]()
SearchCap: Google top searches, Cortana with Harman Kardon & image product schema
Below is what happened in search today, as reported on Search Engine Land and from other places across the web.
The post SearchCap: Google top searches, Cortana with Harman Kardon & image product schema appeared first on Search Engine Land.
What You Absolutely Must Do Before Optimizing Anything

As a digital marketing firm and SEO service provider, a mistake we see made all too often by brands is failing to identify the audience they’re targeting. It may sound like a step significantly less important than others throughout the optimization process, but spending time getting to know and understanding your audience is one of the most important things to do.
The key to not just good, but successful and effective digital marketing is knowing who you’re directing your efforts at, how they will respond to those efforts, and so on. But not exploring your audience impacts user experience, and a negative user experience impacts conversions, and fewer conversions directly translates to less profit and reach. See the problem?
Don’t make the mistake of skipping this important optimization step, and if you already have, go back and get to know your users. Here are some starting points.
Research.
This is a pretty obvious step, but in a world where most interactions are digitally stream lined, it’s become easy to forget. Conducting research to find out who your audience is should be a top priority, and it can be done in a number of ways. You can study the audience of your competitors and do some digging on social media platforms, get out in the field-wherever that field may be-and dispense surveys, and/or conduct interviews. All of these are great starting points to identifying your target audience.
Break the audience into groups.
You might have one big audience, but more often than not you have multiple groups within your audience at large. A perfect example is Target. Target has something for everyone, and there are multiple audience groups within their audience as a whole. After conducting your research, take a closer look at the types of people you’re targeting. Then, build your advertising and optimization efforts around them.
Find out who’s who.
Yes, I’m talking about the influential leaders that exist within your audience. For example, if your business is in the cosmetic industry, find a make-up tutorial guru who has thousands of followers on Youtube and start a partnership with him or her. There are respected authorities within every industry, and finding a way to reach their audience your audience too.
A Beginner’s Guide to Organic Traffic Audience Segmentation with Google Analytics
Call it a case of too much of a good thing.
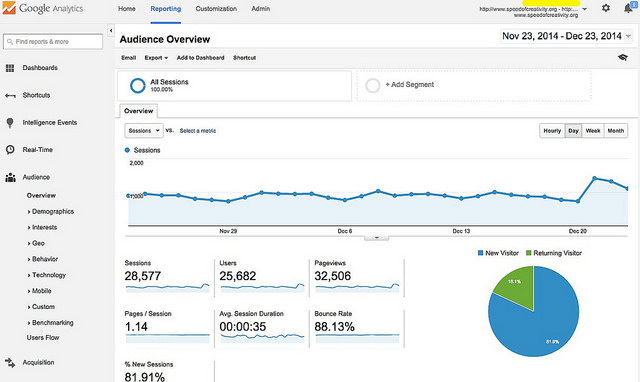
Google Analytics puts a lot of data at your fingertips. It’s a mountain of metrics, and a deluge of dimensions. With it, you can drill deep down into your website visitors, their demographics, and their behavior.
But by default, it just throws everything into one enormous bucket. The reports show stats, graphs, and charts for “All Users/Sessions”.
And while that’s perfect for getting a big-picture-at-a-glance snapshot, you need to break things down a little if you want to find the buried treasure within.
Mixing everything together is good for smoothies, metallurgy, and cocktails. For analytics, you want to separate and segment.
Segmentation in Analytics
Click on any report in Analytics – audience, acquisition, behavior, or conversions – and you get a wonderful presentation of the data collected for your site. For everyone that visited during the chosen time frame (the last 30 days by default).
The beauty of Analytics, though, is in whittling away from general to specific. Of finding the statue of David within the block of marble. Or the chewy core at the center of a Tootsie Pop.
With audience segments, you can break that pile of data into more manageable sections based on the criteria that matters most to you. What insights are you looking for?
Segments group visitors together who share common traits or behavior. And the best part? You get to decide exactly what traits and behavior to group.
Knowing how many visitors you had last week is useful. But how many visitors did you have on desktop devices, from the United States, who viewed at least three pages, but left without making a purchase? That’s the power of segments.
Segments give you ultra-targeted insight into audience behavior, like visitors arriving via mobile, from which country, number of sessions with a conversion, visitor type, demographics, traffic source, value, browser, users with multiple sessions, and so on.
Sounds fantastic, right? Yet 41% are not using audience segments at all. Get out of that group.
There’s no end to the possible combinations you could create (although that’s technically not true…you are limited to 1000 segments that can be edited in any View, and 100 segments for any one specific View). Create an uber-precise segment for tracking and analysis that represents your exact audience and serves your particular needs.
Hit vs Session vs User
When creating a segment, you can often assign the scope as either user, session, or hit, so it’s important to recognize the difference:
Hit – an individual interaction with your website (usually a page view); a visitor did this, a visitor did that, a visitor…
Session – a collection of hits; one complete visit to a website
User – a person’s entire journey with your website (may encompass multiple sessions)
Most experts suggest focussing on users and sessions. It’s all about the relationship you have with them.
Segments: A Simple How-to
Getting started is mercifully uncomplicated. Even an Analytics amateur can create, save, and use segments.
To begin, simply click on the +Add Segment button at the top of any report.
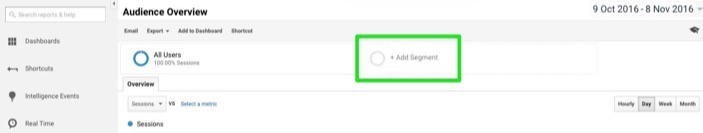
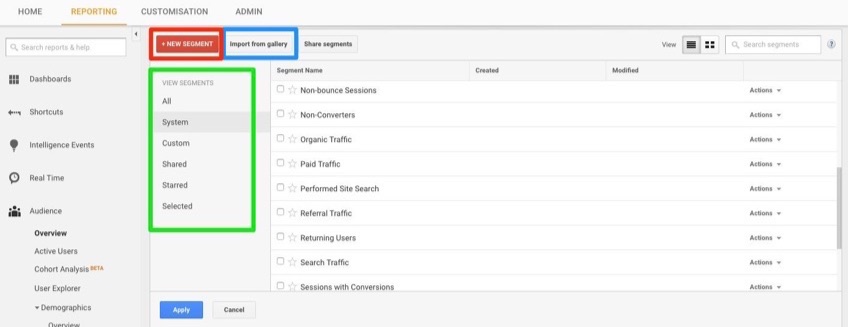
You’ll next see the Segment dashboard, and you’re presented with several options. Down the left-hand side, you’ll find the View Segments column. You can select All, System (the segments pre-loaded on Analytics, like Converters, New Users, and Organic Traffic), Custom (the segments you’ve made), Shared, Starred (you can save segments to this favorites list by clicking the star beside their name), and Selected (the segments you’re currently using).
Do you want to work with an existing segment (select from the list), import from the gallery (custom segments created and shared by others), or create your own new one (click +New Segment to start from scratch, or click on the Actions dropdown beside an existing one, and select Copy to use it as your foundation)?
Let’s copy Organic Traffic. This will allow us to build a custom segment for all incoming organic traffic.
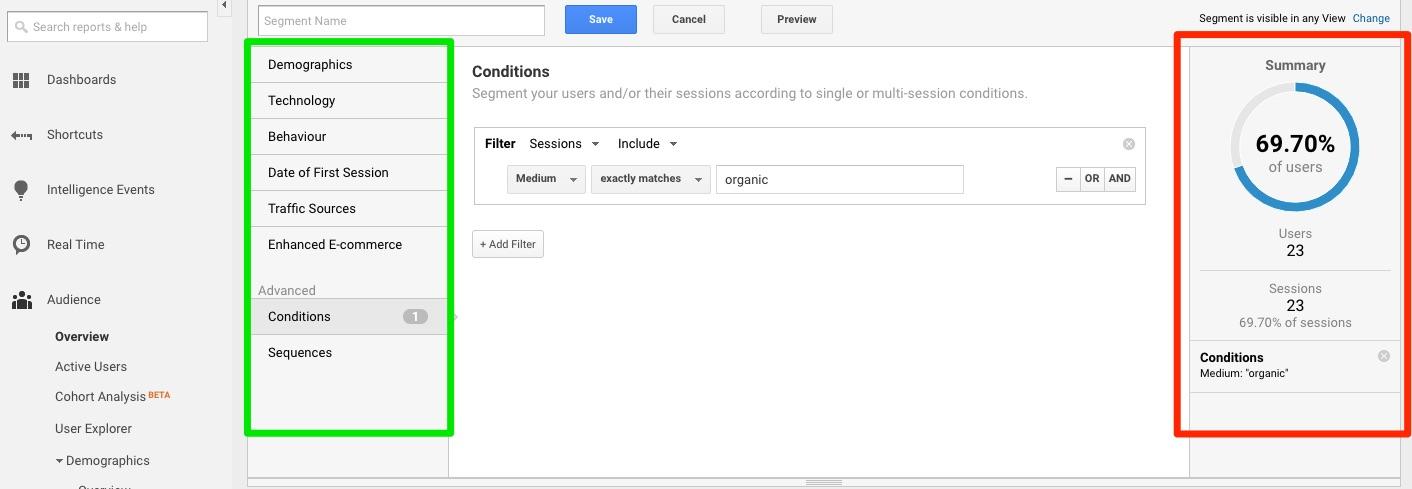
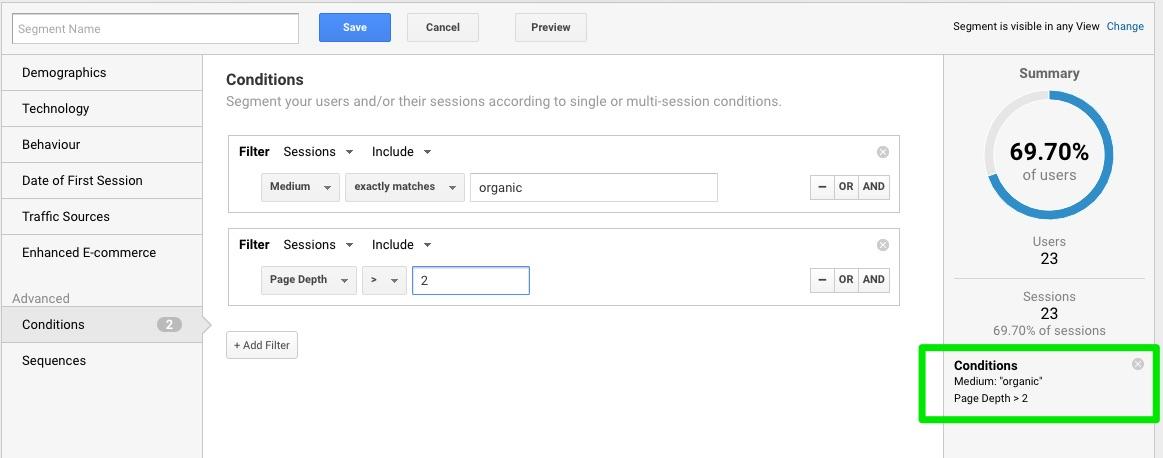
The next dashboard displays the current segment parameters. Because we opted to copy and build upon the Organic Traffic segment, there’s already one criteria listed:
Medium > exactly matches > organic
On the right, you’ll see a segment summary (updated in real-time when you add or delete criteria), and down the left are the categories and filters you can use to define your segment.
Options include Demographics, Technology, Behavior, Date of First Session, Traffic Sources, Enhanced Ecommerce, Conditions, and Sequences.
So far so good. Still with me?
You’ll want to zero in, so we’ll add a few more filters to this segment. Click on the +Add Filter button.
Next, click on the Ad Content dropdown menu, and you’ll see a long list of possible filters and criteria. Click around. Explore. There’s also a handy search field at the top to save you some time.
We’re going to segment by users who’ve viewed at least two pages during a session:
Type “Page Depth” in the search field and select it (it’s found under Behavior if you want to locate it yourself)
Click on “=” and select “>” (greater than symbol)
In the blank field, enter 2
Your summary will update, and you’ll see Medium: organic and Page Depth > 2 listed under Conditions. This segment now includes all organic traffic visitors who look at three or more pages during their session.
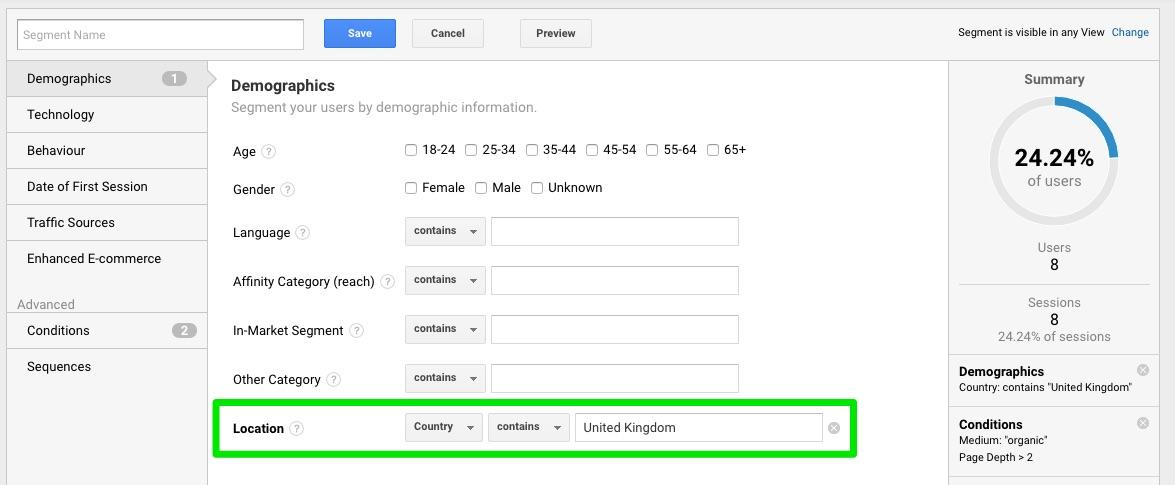
Starting to get the hang of it? Try this one on your own: add a country filter for visitors from the United Kingdom.
Done? Excellent. You can include that filter by either adding another condition (Users > Country > Contains > United Kingdom), or clicking on Demographics > Location > Country > Contains > United Kingdom. Either way, your summary will update, and your segment will now only count visitors from the UK.
We can make “organic” even more precise by adding a filter under Traffic Sources > Source > contains > google
Finally, give the segment a name that reflects what it is, such as UK Page Depth > 2 or something similar (whatever works for you), and click Save.
Congratulations. You just created your first audience segment. Kudos! This one will only exhibit organic traffic from the UK arriving specifically from Google that viewed at least three pages. How’s that for precise data?! It’ll be listed with all the other available segments, ready to be called upon whenever you need it.
Basic Segments
But segments don’t have to be complex. They don’t have to include multiple criteria, either. They can be very simple and straightforward:
By traffic source or medium (email, social, paid, organic, direct, referral, google, facebook, twitter) to get insight into visitor offsite behavior. Where are they coming from, and how are they finding you?
By user type (new visitor vs returning visitor, mobile vs desktop, frequent vs infrequent visitor, long vs short sessions, multiple pageviews vs single page) for insight into their engagement with your brand and company.
By location or language to understand your customer demographics better.
By Content Viewed (product pages, checkout page, thank you page) to get insight into their onsite behavior.
By Engagement (more than x pages, more than x seconds) to see how well your content and presentation is appealing to them.
By revenue, product viewed or purchased, brands added to the cart, or even product variants like specific sizes and colors.
The basic categories along the left on the segments dashboard – Demographics through Enhanced Ecommerce (which does require the ec.js plugin) – are easy to navigate and implement. Try them out.
The Advanced Options
Both Conditions and Sequences are considered advanced options. But that shouldn’t scare you (you’ve already mastered conditions).
As we’ve already seen, Conditions simply set a series of criteria that must be met for a visitor to be included in that segment. It allows for a tremendous amount of customization. There’s a bit of a learning curve – finding the right criterion and definition, for example – but there are plenty of tutorials that can guide you from absolute beginner to pro in no time.
Sequences are a series of conditions that must be met in order (step 1, step 2, and so on), but the fundamental idea is the same. A sequence where users visit your cart (step 1) but then don’t go through with an actual purchase (step 2) gives you an audience ripe for a follow-up.
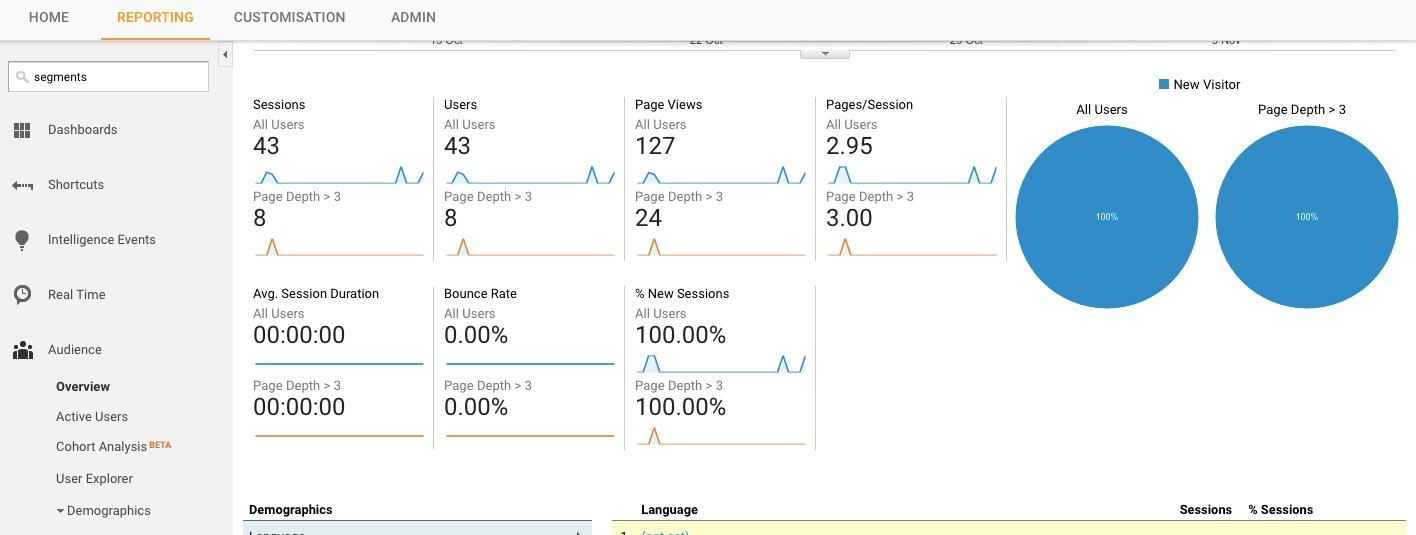
The More the Merrier
Once you have a few favorite segments, you can start to compare one against another. Go to any report, click on +Add Segment, choose up to four different ones, and click Apply. You’ll then see the report with all segments presented at one time…color-coded for your convenience (thanks Google). Compare and contrast.
Get Fancy
The more comfortable you get with segments, the more you can create ones for every possible group of your audience.
How about a segment that shows you frequent and recent visitors that still haven’t purchased something?
+Add Segment
Behavior – Days Since Last Session < 5 (less than five)
Behavior – Sessions > 4 (more than four)
Behavior – Transactions = 0 (no purchases), or even Conditions – Page Title – contains – thankyou.html (your order confirmation page, but make sure you select EXCLUDE rather than include)
Once you’ve created a segment like this one, you can then create an Audience from it, and target only that group with ads promoting your free shipping, or current sale, or special coupon to entice them to pull the trigger (they’re obviously interested).
Creating an Audience from a Segment
Segments give you valuable, targeted data. And that’s a very good thing.
But they can extend beyond the Analytics dashboard if you create an Audience from a segment.
For the UK Page Depth > 2 segment we created earlier, let’s assume you’d like a way to send them – and only them – a special ad for a discount available only to UK residents.
Head to the segments list, find that segment, select Actions, and click Build Audience.
For this to work, your Analytics and Adwords accounts need to be linked (but don’t worry, Google walks you through it if they’re not yet connected).
Choose the View (your ecommerce site) and Destination (your linked Adwords account), and define the Audience. The definitions (i.e. criteria) will be prepopulated based on the segment you selected.
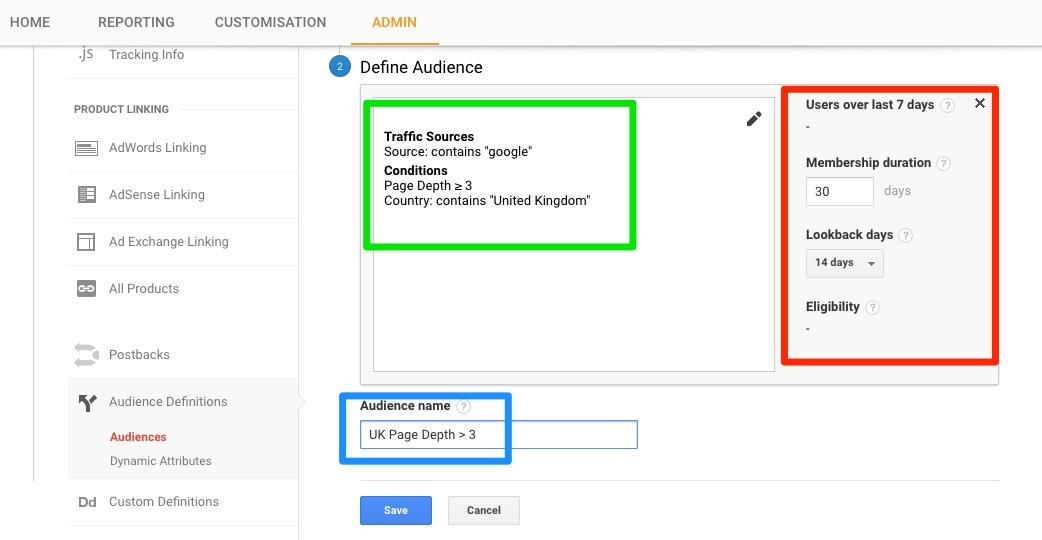
On the right, you’ll see a few fields:
For segments scoped to hits or sessions, you’re limited to Users over last 7 days (this will present the estimated size of this audience from users that meet the criteria in the last week).
Membership duration sets how long visitors will remain a member of this audience once slotted into it, anywhere from 1 to 540 days. If you’re creating an Audience for visitors with a recent purchase, for example, you’d set this for a relatively short period of time.
Segments scoped to Users gives the option of lookback days, either 7, 14, or 30. This is a time frame for Analytics to go back and find users that qualify for the Audience.
Eligibility tells you where you can share this audience, such as search and display ads (Adwords), or Google Optimize (for testing and personalization).
Give the Audience a name to help you remember it over in Adwords, and click Save. Done.
When you’re next in your Adwords account, you can select this Audience and create a targeted ad for them about your exclusive coupon for those in the land of tea, bangers, and mash.
It may be the gentle push they need.
See how everything comes together in the Googleverse?
Segments allow you to identify strengths, weaknesses, and patterns, find reliable revenue sources, and provide the guidelines to improve where you’re falling short.
There are many stellar custom segments ready to import, you can experiment and create your own, or simply utilize the ready-to-go standard segments there already.
The Google Analytics Help portal provides everything you’d want to know about segments but were afraid to ask.
They’re often ignored, but always beneficial. You can use them to track your most lucrative markets, identify where, when, and how the big spenders are coming to you, remarket to specific groups at just the right moment (via Adwords and Audiences), and more.
Anything you can do to better understand your audience behavior and acquisition is time well spent. Grasp the basics of segments, move on to more advanced techniques, and know your audience like never before.
It’s big data broken down.
Have you jumped in the audience segmentation pool? What filters do you find most insightful? Leave your comments below.
About the Author: Aaron Agius is an experienced search, content and social marketer. He has worked with some of the world’s largest and most recognized brands to build their online presence. See more from Aaron at Louder Online, their Blog, Facebook, Twitter, Google+ and LinkedIn.
8 Statistics That Prove Content Marketing Is the Best Brand Marketing by @JuliaEMcCoy
Seth Godin once said: content marketing is the only marketing that’s left. Effectively done, it gives a brand an image and a voice that speaks volumes to the audience’s direct needs and problems, with a solution. Learn 8 strong statistics on why content marketing is today’s marketing.
The post 8 Statistics That Prove Content Marketing Is the Best Brand Marketing by @JuliaEMcCoy appeared first on Search Engine Journal.
![]()
Mobile Reader Survey: Voting Now Open!
With 677 entries from 343 companies across 27 categories, ClickZ and Search Engine Watch’s inaugural mobile reader survey has been compiled and is now open for voting!
Designed to reward technology vendors and agencies at the cutting edge of delivering mobile solutions, services, content and technology, the power is now in you, our reader’s hands to select the winners!
![]()
Voting rules:
You may only vote for one company in each category.
You may not be an active employee of the company that you are voting for.
If you do work for one of the companies, you are encouraged to promote the survey to your clients and network, but you may not vote for your own company. You are eligible to vote in any of the categories which do not feature your company.
We will be collecting basic information to be able to authenticate your entry against these rules. Please ensure that you use your business email address.
Voting will close on January 20th, 2017 and a Shortlist of the winners will be announced during the Mobile Content takeover on January 24th, 2017. Winners will be announced and published in an exclusive ‘State of Mobile Report’ which will go live on February 6th, 2017.
For more information on how to get involved in our Mobile Content Takeover please contact sam.lawson@clickz.com.
The categories:
Data
Best CRM or Data Management Platform
Best Mobile Engagement Platform
Best Mobile-first Marketing Automation Platform
Agencies
Best Overall Mobile Agency
Best Mobile Agency (SMB)
Best Mobile Search Agency
Analytics
Best Mobile Analytics Platform/Provider
Best App Analytics Platform
Attribution
Best Cross Device Attribution Platform
Apps
Best App Developer
Augmented Reality
Best AR Solution (Delivery/Technology)
Best AR Content Creation Agency/Firm (Content
Virtual Reality
Best VR Solution (Delivery/Technology)
Best VR Content Creation Agency/Firm (Content)
Location
Best Location Data Provider
Best Location-based Services (LBS) or Proximity Based Technology
Best Mobile Ad Server
Best In-App Mobile Advertising Solution
Best Native Advertising Mobile Solution
Best Mobile Video Advertising Platform
Display
Best Mobile Ad Network
Best Supply Side Platform (SSP) /Exchange
Best Demand Side Platform (DSP)
Content
Best Mobile Content Creation Firm/Agency
M-Commerce
Best Mobile Billing or Payments Provider
Call Technology
Best Mobile Click to Call Technology
⋆ Overall ⋆*
Most Innovative Mobile Marketing Technology/Solution
*This is the only category where the winner will be decided by our editorial team.
![]()
Inbound Marketing’s Second Act: 4 Things Every Inbound Marketer Should Do in 2017

2016 marks HubSpot’s 10th anniversary. When my co-founder Dharmesh Shah and I first started talking about the concept of inbound marketing, it wasn’t an evolution — it was a revolution. Instead of big brands beating small companies with expensive TV commercials, massive billboards, and other types of outbound campaigns as a foregone conclusion, content and search marketing equalized the playing field. Marketing became much more about the width of your brain than the width of your wallet.
Fast forward to today. While the fundamental tenets of inbound marketing still ring true, many of the specific channels and methods prospects are using to find, evaluate, and purchase products are different than 10 years ago.
Even the supply and demand dynamics have changed. In 2006, prospects had an average of four to five choices for any product or service they were looking to purchase. In 2016, I’ve found that that number has spiked to approximately 14 or 15 different vendors — and this holds among most industries. Choices that once occupied a few inches on a shelf at a retail store now expand endlessly on the infinite shelf of ecommerce sites.
Supply is way up, and demand is relatively flat. The increased competition means understanding how your prospective buyers research and buy is even more critical.
I’ve spent the last year studying the changes in prospect behavior, and I’ve come to the conclusion that we’re looking at another revolution — which heralds the second act of inbound marketing.
Here’s what that means for you, your prospects, your business, and your 2017 marketing plan.
The Second Act of Inbound Marketing
How to Get Found in 2016 (or, Why Google Is Now Ask Jeeves)
Back in 2006, Google helped buyers find the answers to their questions by serving up links to relevant information. Increasingly today, there’s no click needed — Google just gives searchers the answer directly through a rich answer box. The numbers vary on this but research has found that between 20 and 35% of searches performed today result in a quick answer box populated on the SERP itself.

Need an answer fast? Just ask. That’s right, Google has finally fulfilled the original Ask Jeeves promise. In our own research we’ve found that clickthrough rates from these answer boxes are also higher than traditional links. RKG Merkle saw a 516% increase in sessions when a client’s page captured the snippet box.
To adapt, companies should start to create content not just intended to rank in search, but also to be pulled into Google’s quick answer box, and educate your buyer directly on the SERP. Here’s a blog post on how to do this.
Quick answer boxes are not the only way Google is changing. Ten years ago, paid AdWords results took up about 50% of the screen “above the fold.” Today, because of a layout shift Google introduced earlier this year, AdWords ads have moved from the right column to the center and take up nearly 100% of the “above the fold” space on both desktop and mobile.
All of which means: If you have the budget, it’s worth integrating ads into your inbound strategy. But how do you run ads in an “inbound” way? Well, bad ads are still useless. If you have a piece of content, however, that’s taken off organically, that’s a good indication it could be even more useful if amplified by some paid budget. I’d suggest using your ad budget to boost quality content that has already done well on social media.
Speaking of social media, Facebook’s Lead Ads product, which enables buyers to complete a form directly in their newsfeeds, is opening up new opportunities and levels of transparency into an ad campaign’s effectiveness. Whereas once we had PPC, we’re now seeing the early days of PPL: Pay Per Lead.

The ad industry is at a significant precipice. On the one hand we’re seeing a drastic rise in usage of ad-blocking technology; according to the 2016 State of Inbound report, mobile ad blocking has increased 90% year-over-year. On the other, ads are getting more space in search engine results and offering better clarity around their cost per lead ratios. All of this will inevitably influence the way prospective customers find your company.
How to Create Compelling Content in 2016 (or, Why the Silent Movie Is Back)
The way people find answers and discover companies is changing, but so is the format of content itself. Here’s what I’ve noticed about the types of content working well today.
In short: Reading is out, watching is in. Ten years ago, the power content marketing move was search + written content. Now, it’s social media + video content.

And these aren’t the hyper-produced, long-form videos from years past. The marketing teams winning the video game today are mastering live, off-the-cuff video. Additionally, Charlie Chaplin would likely raise an eyebrow to learn we’ve tƒurned away from talkies: A full 85% of videos today are watched without audio.

Increases in mobile usage have fueled much of this growth in video popularity. For content marketers, the takeaway here is simple. While text is still important, you may want to stop looking for that next blogger, and start looking for a video producer. At least 50% or more of your marketing content next year should be in video format, either hosted natively on social or created with social distribution in mind.
The other thing to know about content consumption is much of it is now happening away from the bounds of your website on social media. Social media has evolved from a promotion channel alone to a platform for content. Buyers aren’t just stopping by social media sites during work breaks anymore — they never leave.
Facebook in particular has started to dominate how we spend our free time. Four of the apps consumers use most — Facebook, Instagram, Messenger, and WhatsApp — are owned by Facebook. Today’s buyers are plugged into Mark Zuckerberg’s universe all day long. If you’re not meeting them there, you risk losing them.
How Buyers Buy in 2016 (or, Why Uber Wrecked Your Website)
Ten years ago, your website augmented your sales rep. Buyers would browse the website to get the basics, and then hop on the phone with a salesperson to get into the nitty gritty.
Today, it’s the opposite: Your sales rep augments your website. Buyers want a self-service experience, making a purchase directly onsite or contacting Sales when they’re ready, not the other way around. Indeed, only 19% of buyers in a HubSpot Research study said they wanted to talk to a salesperson during the “awareness” stage of their purchase process.
And the website of 2006 won’t cut it. Your prospects have been trained in every industry to expect automation, personalization, and self-service. They have been spoiled by Uber to expect a consumer-grade, on-demand buying experience. A website that doesn’t enable viewers to get on-demand information or instantly chat with Sales or Support frustrates your buyers and will send them into the arms of your competition.

Throughout the entire buying process — from your ads, to your website (mobile and desktop), to your live chat service — buyers expect personalization. They expect you to remember them, give them fantastic service, and enable them to serve themselves through automation.
My Advice For Marketers in 2017 and Beyond
Here are the four things I think every marketer should do next year:
Invest in video. Diversify your content playbook to include social + video in addition to text + search.
Live in social. We’re not B2B or B2C marketers — we’re business to human marketers. Humans live in Snapchat, Instagram, Messenger, and a host of other social apps. Find them there.
Accelerate your content. Combine content marketing and paid marketing. Repurpose your most successful content for multiple channels and boost it with budget.
Automate your buying process. Buyers expect to be able to buy on their timeline with either minimal or no human contact.

2017 marks the second act of inbound marketing. Are you ready?
![]()
Monetizing your SEO expertise
Columnist Stephan Spencer discusses how you can use SEO knowledge to build assets that make money for you, rather than having all the gains go to your clients.
The post Monetizing your SEO expertise appeared first on Search Engine Land.
6 Google Analytics Reports That Will Bring Every SEO Lots of Cheer! by @annaleacrowe
Let’s just come out and say it: Google Analytics reports make our life easy as SEO marketers. Here I dish on what Google Analytics reports bring my holiday cheer this season!
The post 6 Google Analytics Reports That Will Bring Every SEO Lots of Cheer! by @annaleacrowe appeared first on Search Engine Journal.
![]()
85% of Digital Marketers Publish Videos on YouTube [DATA] by @rinadianewrites
Video is one of the search marketing trends to look forward to so now would be the perfect time to add video to your marketing strategy. But what’s the best platform to publish videos? Look no further because we’ve got answers from our #SEJSurveySays poll!
The post 85% of Digital Marketers Publish Videos on YouTube [DATA] by @rinadianewrites appeared first on Search Engine Journal.
![]()